Chrome DevTools
Sometimes you may notice a change detection run without seemingly no apparent cause for the run.
Finding the root cause might prove to be difficult. In Angular, a change detection cycle might be triggered
by a variety of browser events related to UI interaction,
network requests or timers. In real life applications those events are intertwined in such a way that makes
it pretty hard to pin down the cause for a particular change detection run.
That’s where browsing debugging capabilities come very handy.
Chrome Dev Tools is an indispensable utility for us when we need to figure out the workflow
that leads to a change detection run. In this section I’ll show you how to use the callstack,
logpoints, filtering and local overrides tools to track down the cause for unexpected change detection runs.
Let’s start with the simplest scenario. We have a UI element rendered on the page. We notice that when we hover
over that element the change detection happens.
This is a common scenario for third party libraries that attach event handlers to UI elements
that we’re not aware of.
To emulate this case, let's use the following implementation:
@Component({
	selector: "app-root",
	template: `
		<div (mouseover)="(0)">Just a plain div</div>
		<child-cmp></child-cmp>
	`,
})
export class AppComponent {}

@Component({
	selector: "child-cmp",
	template: `
		<div>Changes detected: {{ n }}</div>
		<button (click)="fetch()">Fetch</button>
	`,
})
export class ChildComponent {
	n = String(Date.now()).slice(-4);

	ngDoCheck() {
		this.n = String(Date.now()).slice(-4);
	}
}
And that’s how it looks:
Assume we don’t know about the mouseover event listener that triggers the change detection run.
We need to find that out using the DevTools. Here’s how we do it.
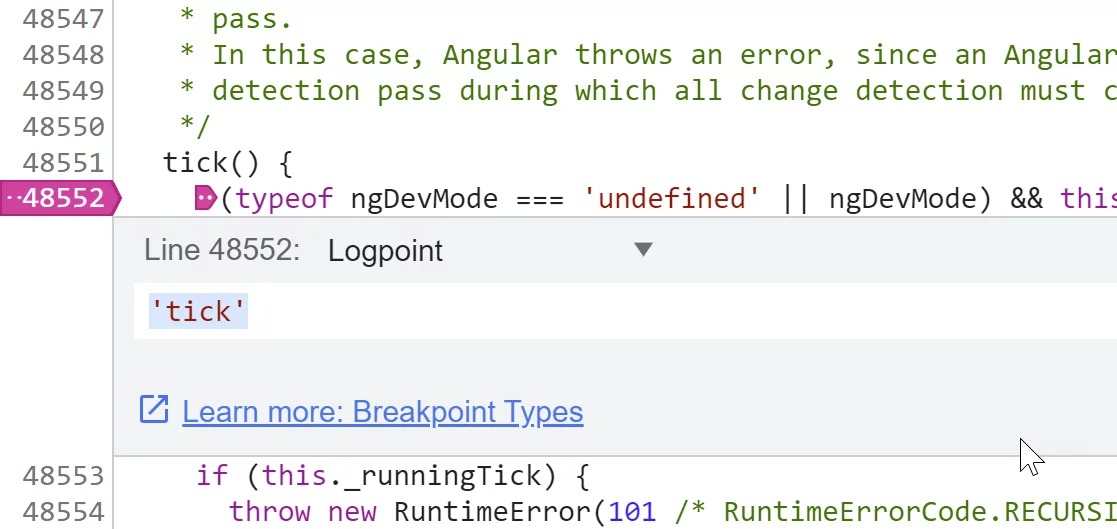
The first step is to pause the change detection by putting a breakpoint inside the template function of the component
that is affected by the change detection run. In our case it’s ChildComponent.
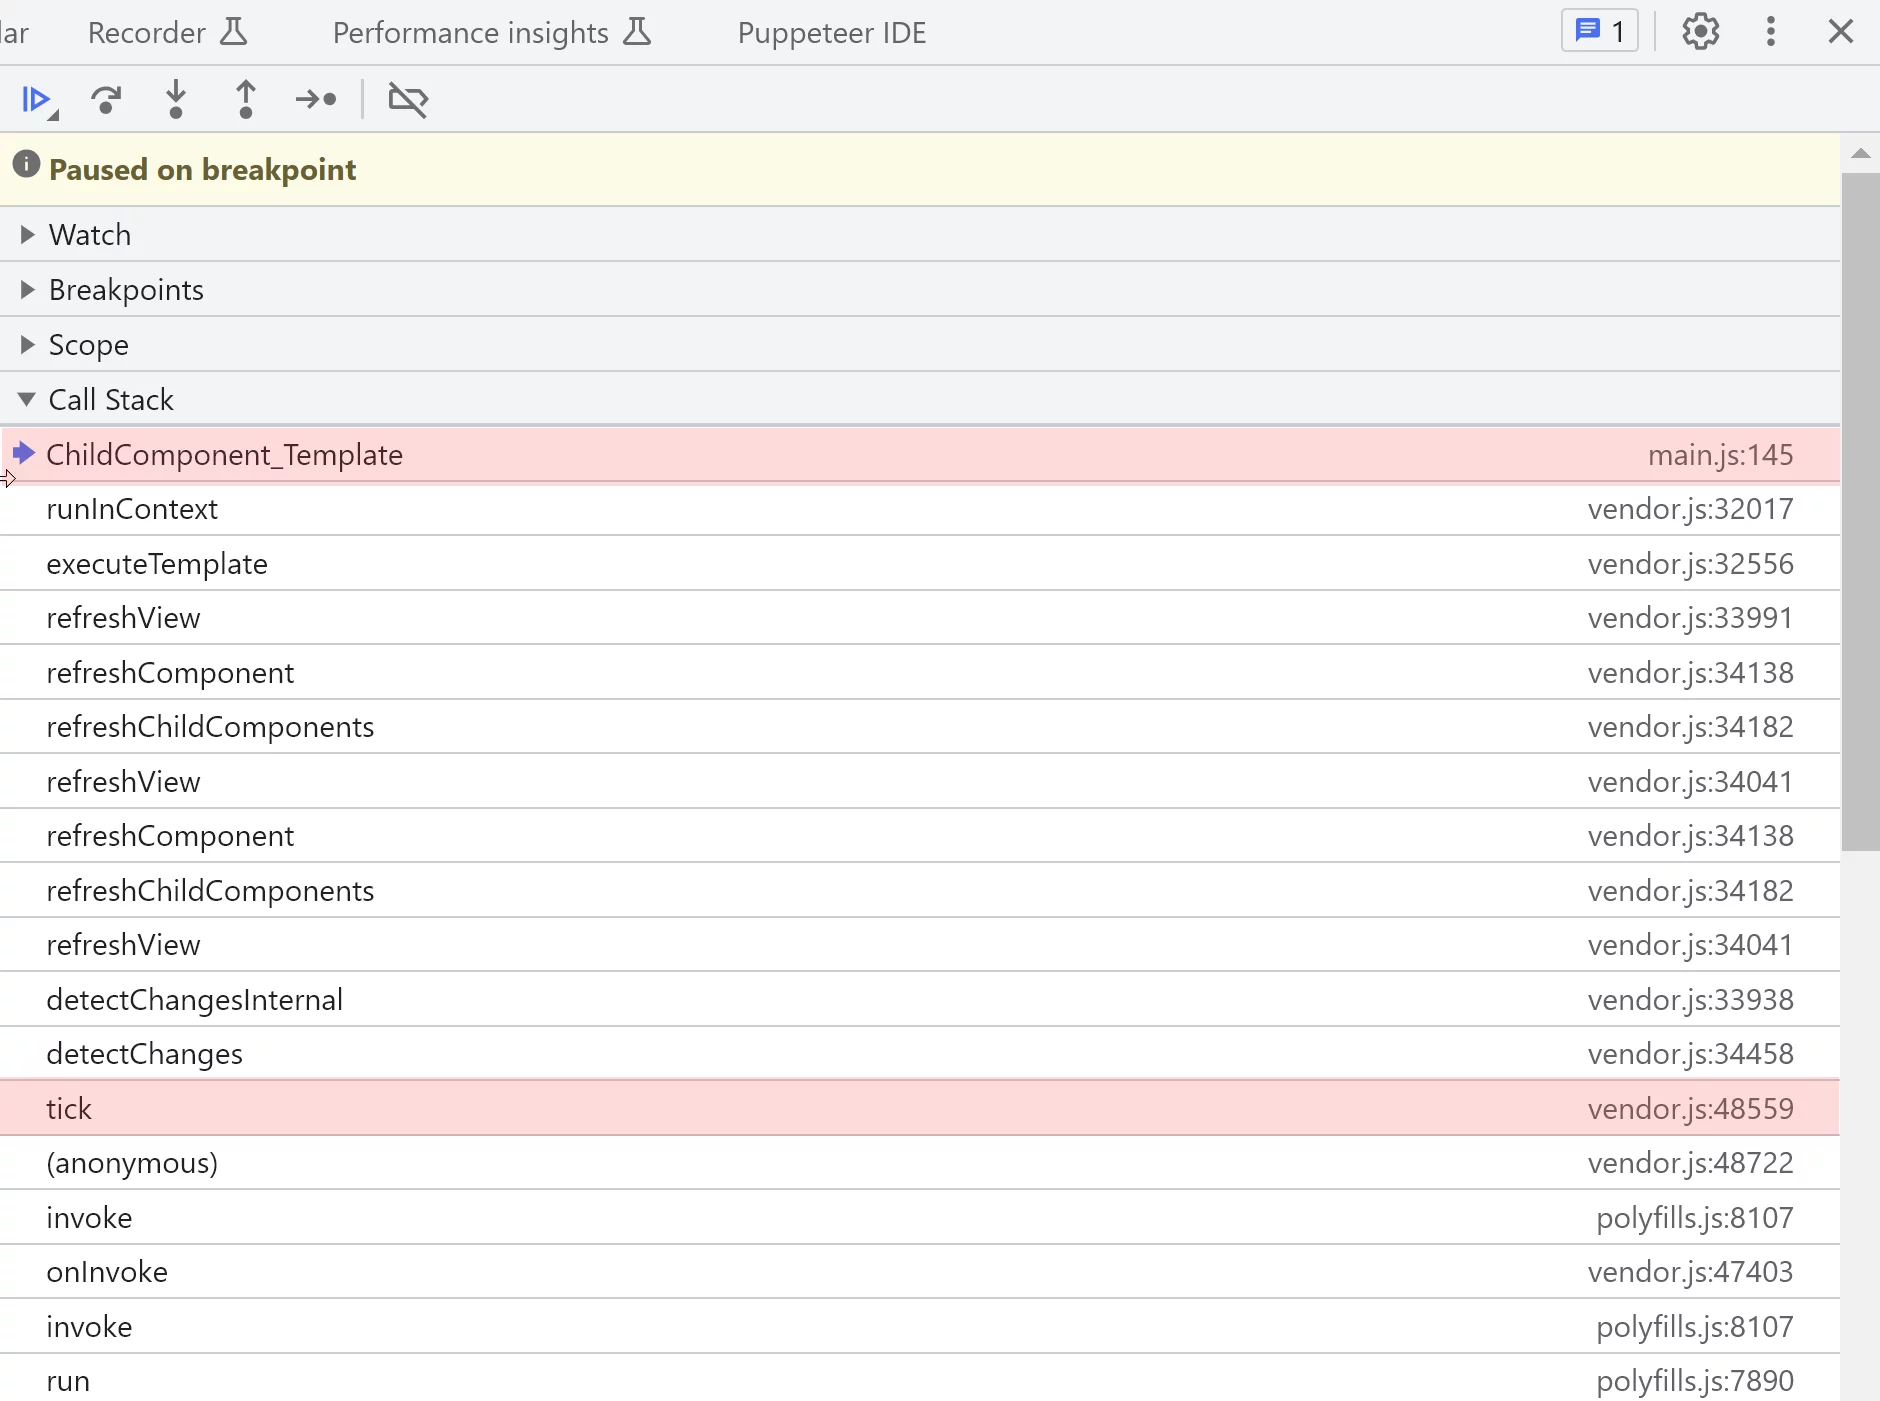
When the change detection is paused it looks like this:
You need to find the component definition generated by the compiler in the sources.
If you can't do that using
global search,
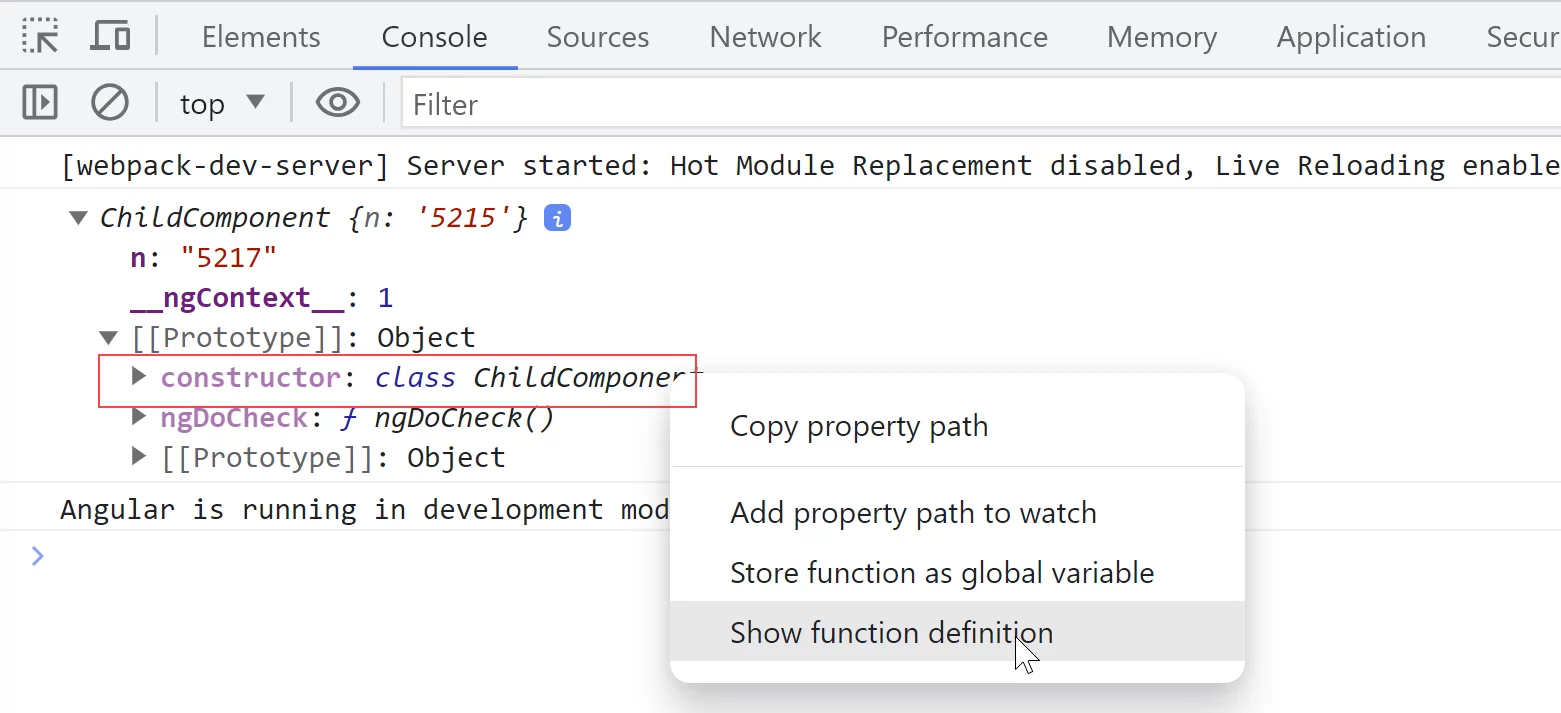
simply output the instance of the component into the console:
@Component({
  selector: 'child-cmp',
	...
})
export class ChildComponent {
  constructor() {
    console.log(this)
  }
}
and then use “show function definition” functionality like this to locate the class definition:
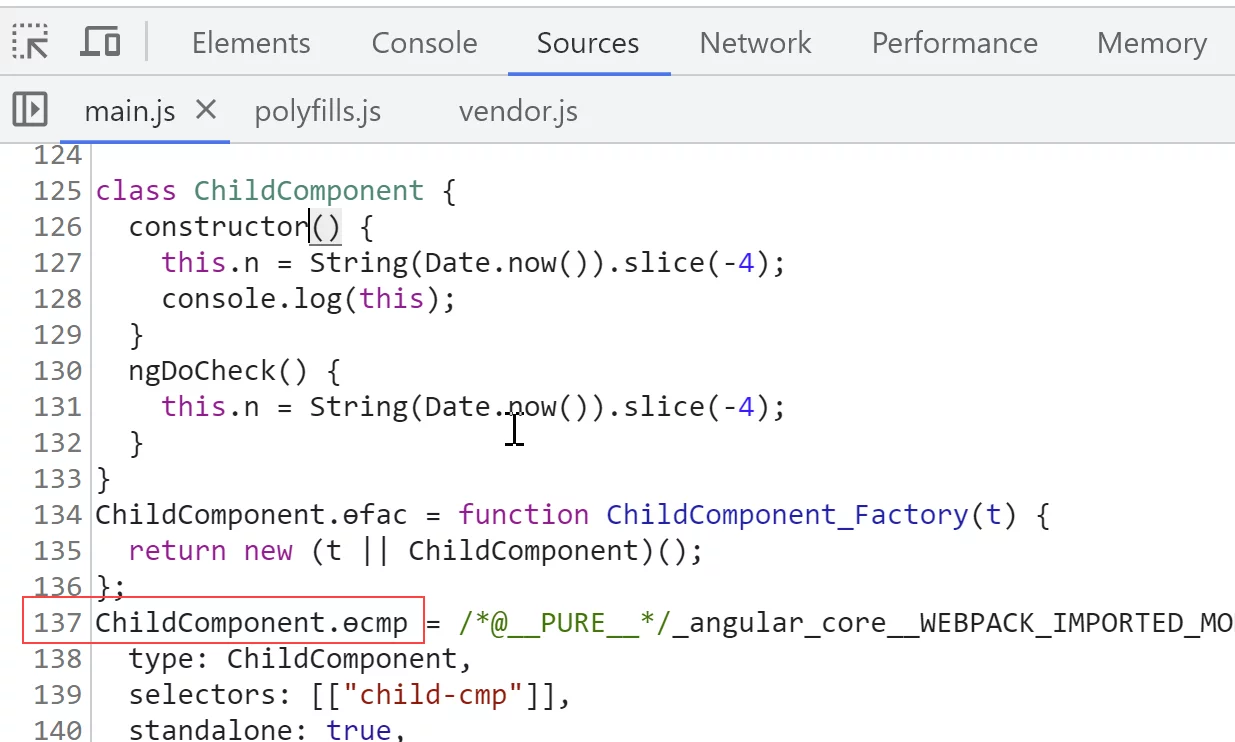
The template function generated by Angular’s compiler should be right underneath the component's class:
Once you put a breakpoint into the template function, hover over the box. When the debugger pauses the execution,
we can inspect the
callstack.
What we can see here is that this time Angular simply runs application
wide change detection that started from the tick function:
If this was a local change detection case, we’d see the function
in the callstack that triggered change detection instead of the tick method.
It could look like this:

When it comes to the global change detection that starts with the tick function,
we need to inspect what happened before the tick function. In particular,
we’re interested in the event that is executed by AngularZone before it runs the checkStable
function and sends a relevant notification to Angular.
With the callstack that we have for our example,
we need to explore the orange part that happens before the tick method:
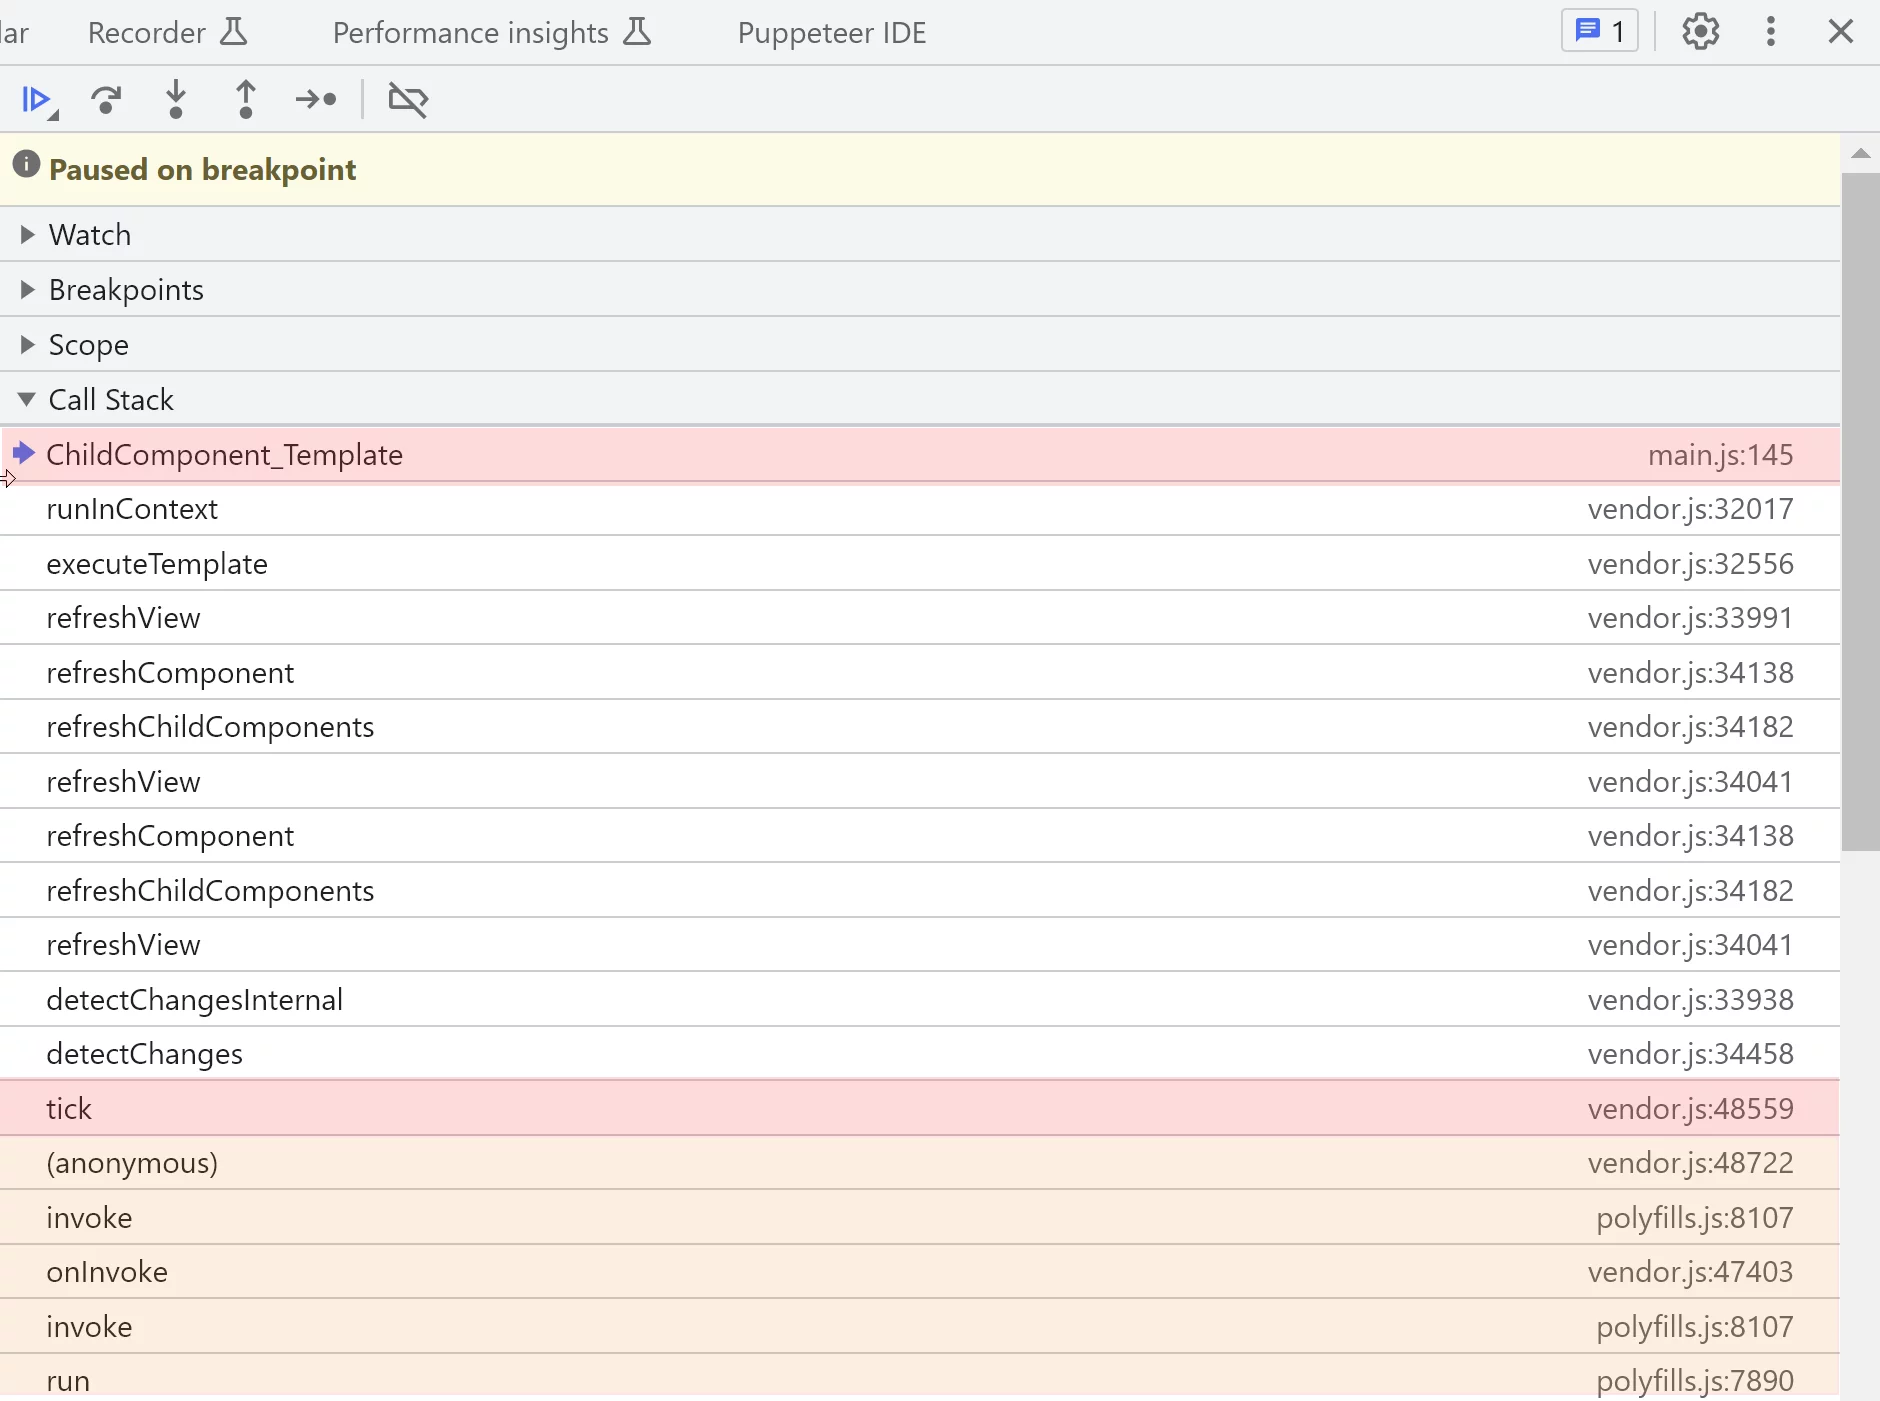
We're interested in the event that leads to calling tick method.
We can learn some useful information about the task inside the onInvokeTask callback.
That's the callback that Zone.js runs when the task is completed.
Let's switch execution context to the function by clicking on it in the callstack and inspect the relevant event like this:

Here, we can clearly see that the mouseover event is the cause for the change detection run.
Using logpoints
In a real life applications there will be tens if not hundreds of events that happen
almost simultaneously and trigger change detection. Trying to pinpoint one individual event
by pausing the executing might not be feasible. In this case, a lot more efficient
approach is to use
logpoints.
We need to log all events that come through Zone.js mechanism.
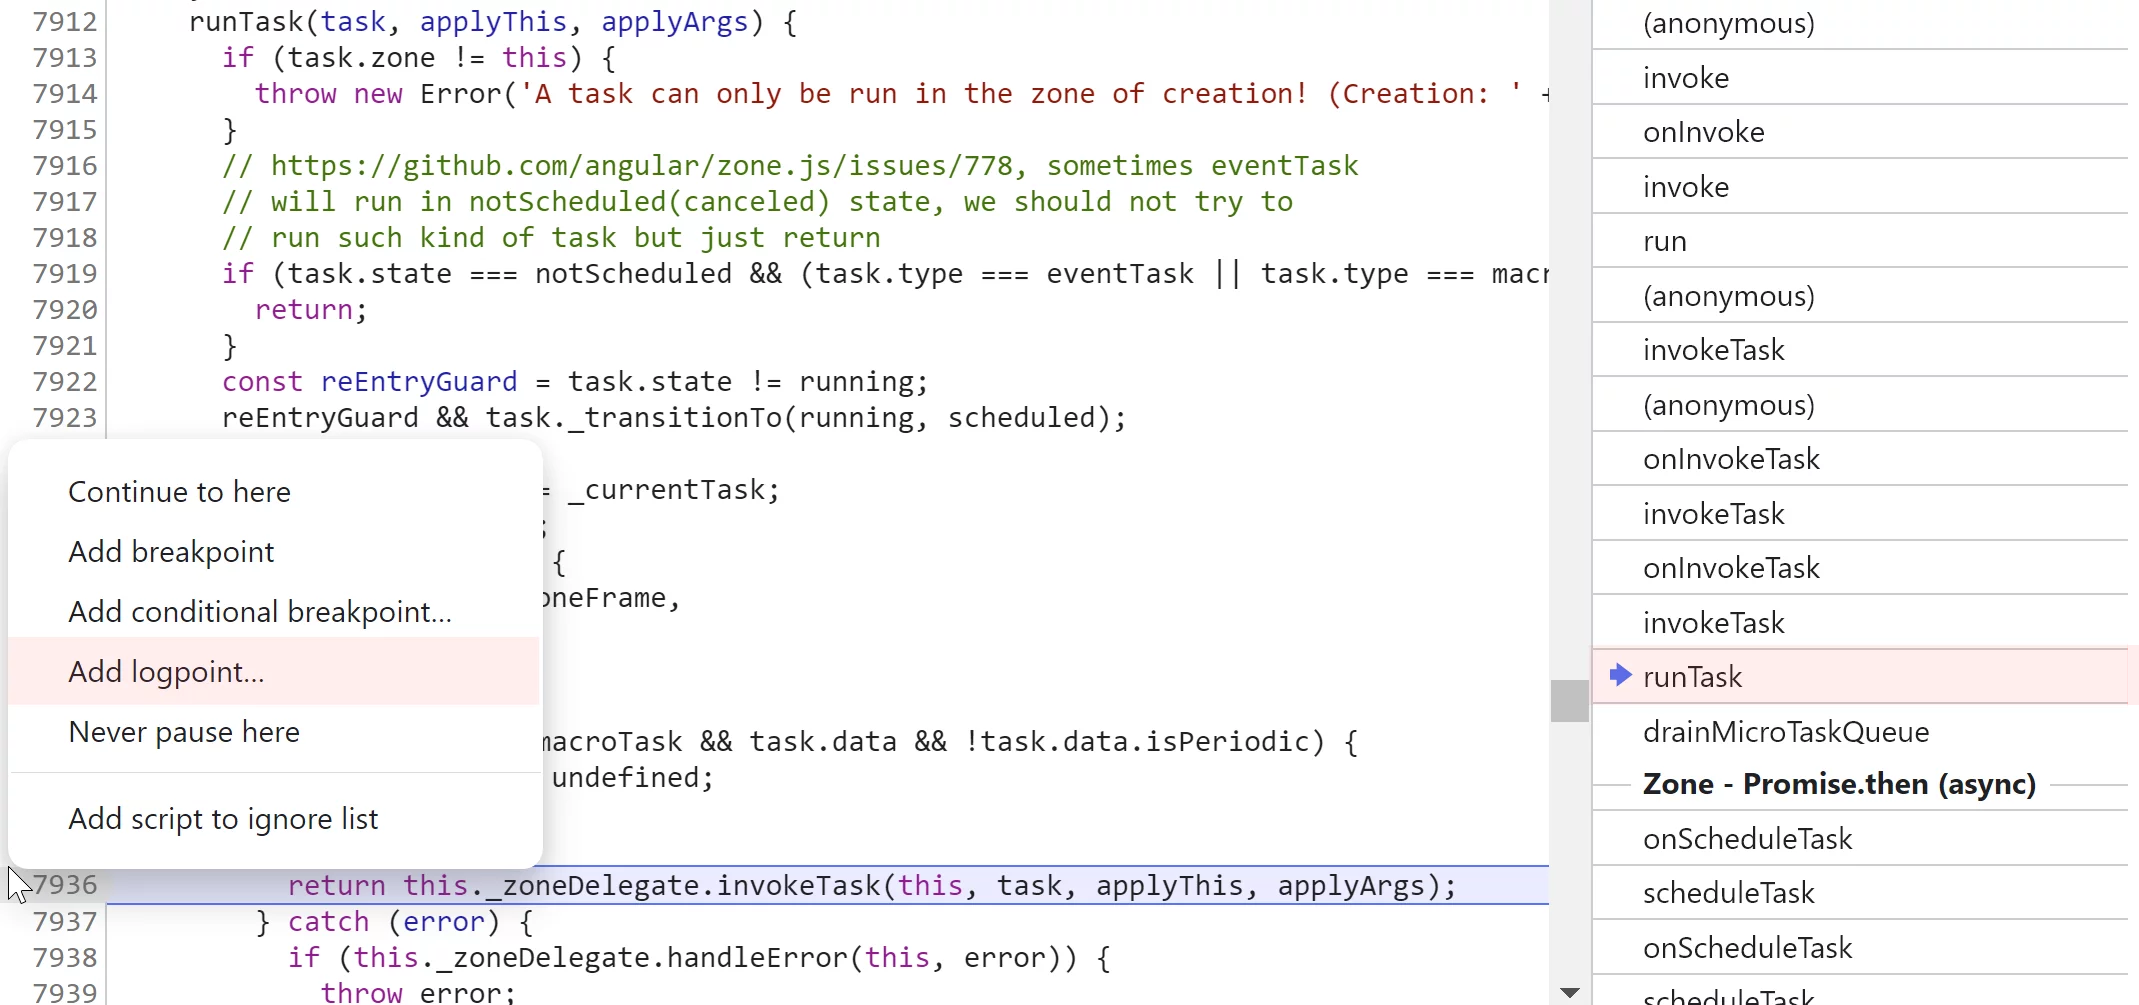
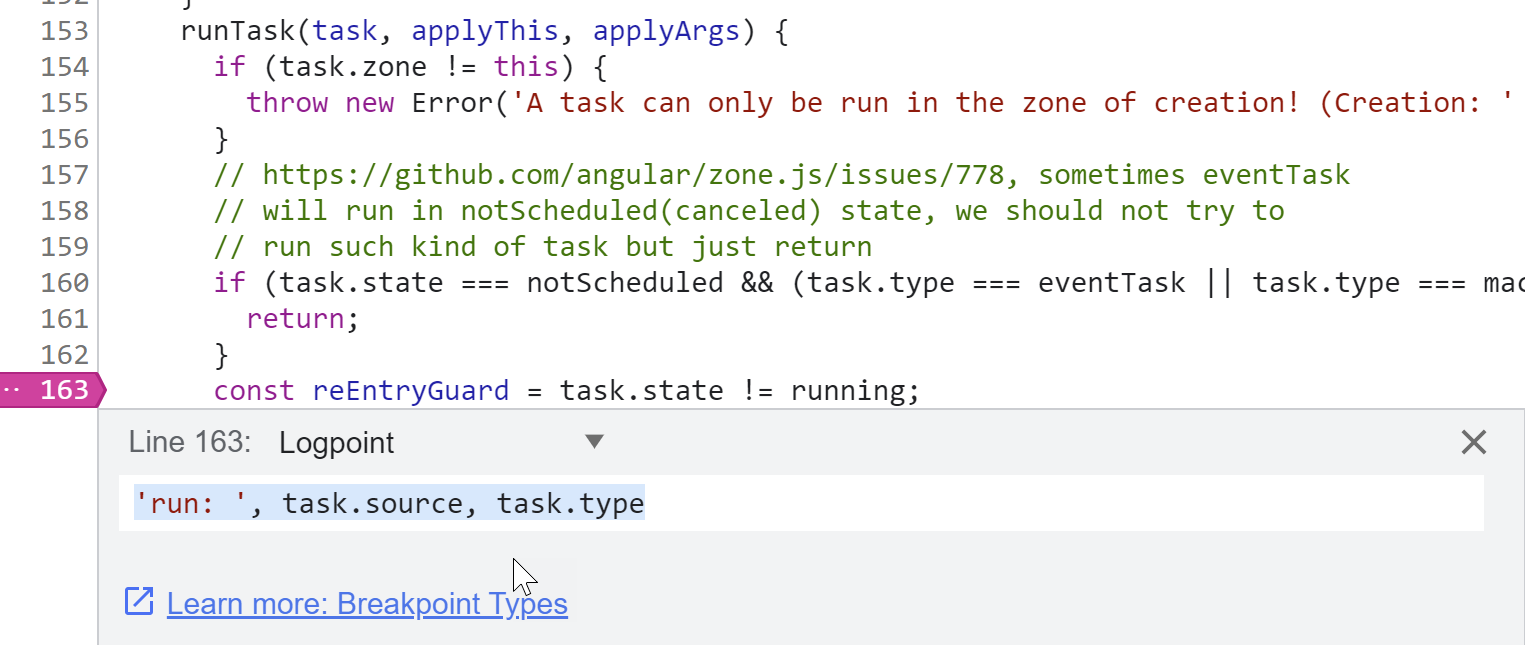
Let’s add a logpoint to the
runTask
method like this:
A zone task
contains the following information:
- source – API name which requested the scheduling of the task
- target – event target, like DOM elements for UI events
- eventName – native event names like click, mouseover etc
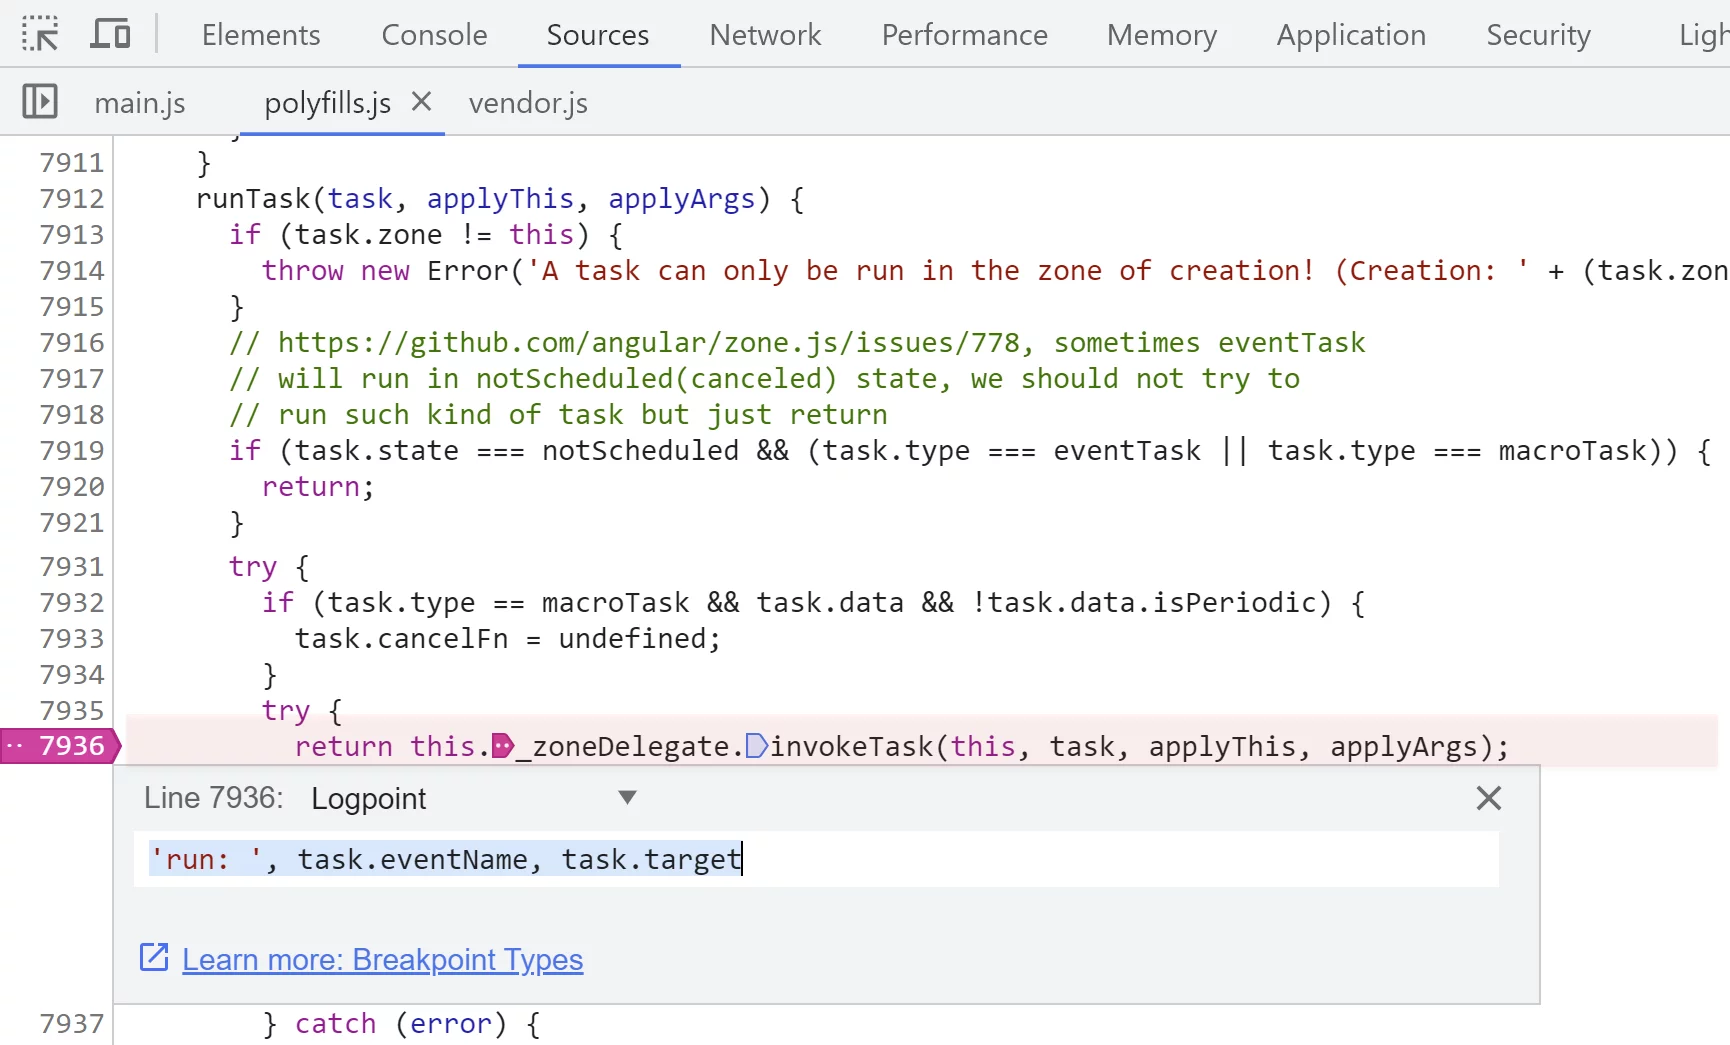
Let’s start by adding a logpoint that outputs two properties eventName and target:
When we hover over the box on UI, that’s the output we see in the console:
The logpoint shows us that the event name is mouseover and the target of the event is the div DOM that is our UI box.
What we can also do is to log the
tick
method call. This will give us a clear indication when Angular runs the change detection:
This time, when we hover over the box, we can clearly see in the console how the mouseover event leads to the change detection:
Sometimes change detection is triggered by a macrotask that has a time span between its start and end time.
A good example is network or timer events. For this type of events, to figure out the cause for change detection,
we need to track the scheduling part as well.
Tracking down a task source
Let’s change out UI a bit. We’ll introduce the button that will run a network request:
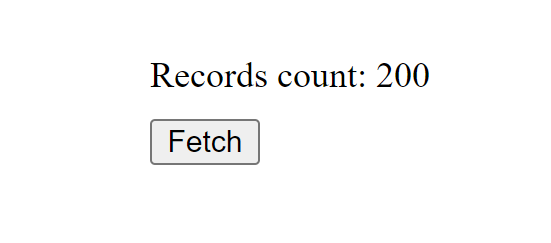
Here’s how the implementation looks like:
@Component({
	selector: "child-cmp",
	template: `
		<div>Records count: {{ recordsCount }}</div>
		<button (click)="getTodos()">Fetch</button>
	`,
})
export class ChildComponent {
	getTodos() {
		fetch("https://jsonplaceholder.typicode.com/todos")
			.then((r) => r.json())
			.then((c) => (this.recordsCount = c.length));
	}
}
In this example zone.js will need to handle two tasks – a network request and a few promises resolved through then.
We're interested in the scheduling part which will lead us to the source of change detection run.
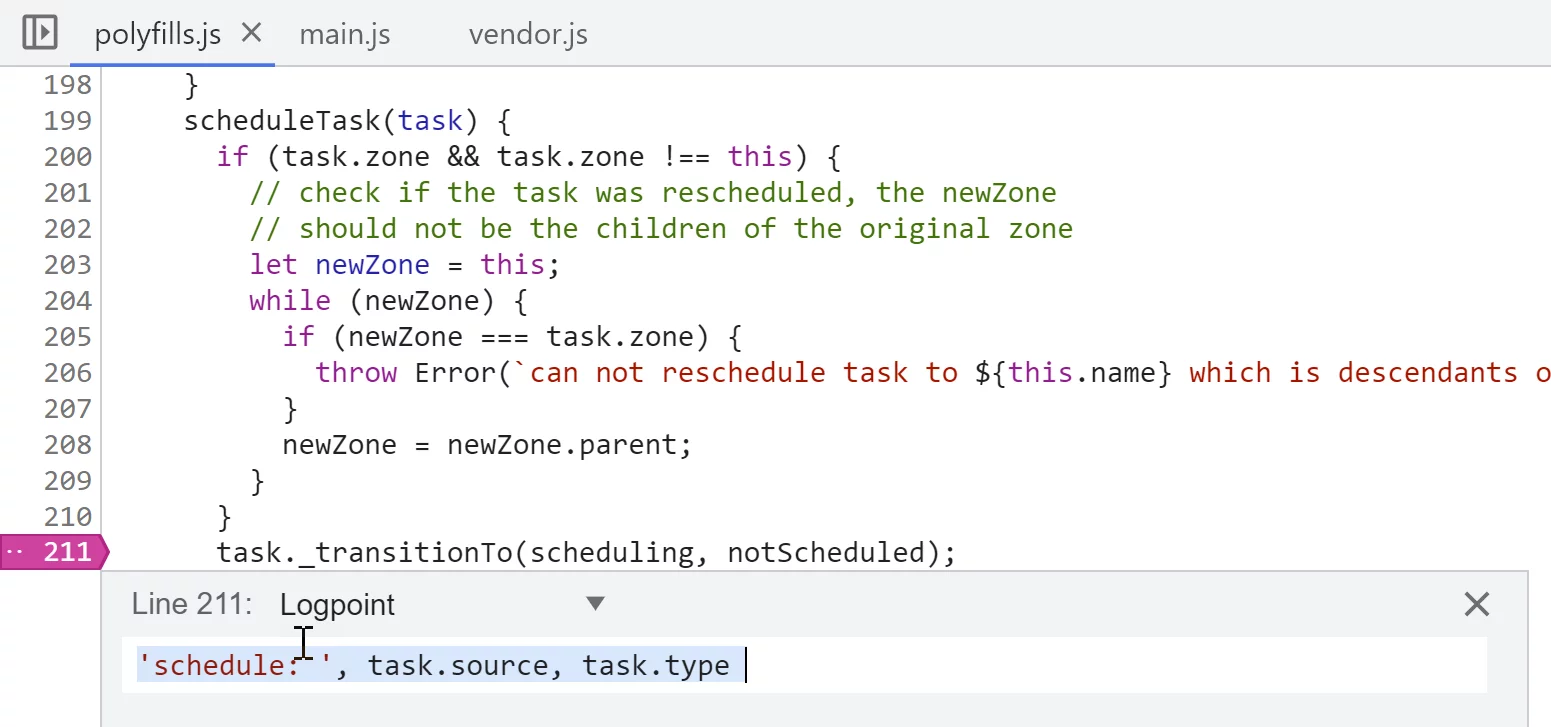
Scheduling of tasks happens inside the
scheduleTask
method. That's where we'll add a logpoint to output the source and type properties of the event:
We also have logpoints in the tick and runTask methods:
When we click the button, with those logpoints in place, we observe the following sequence of events in the console:
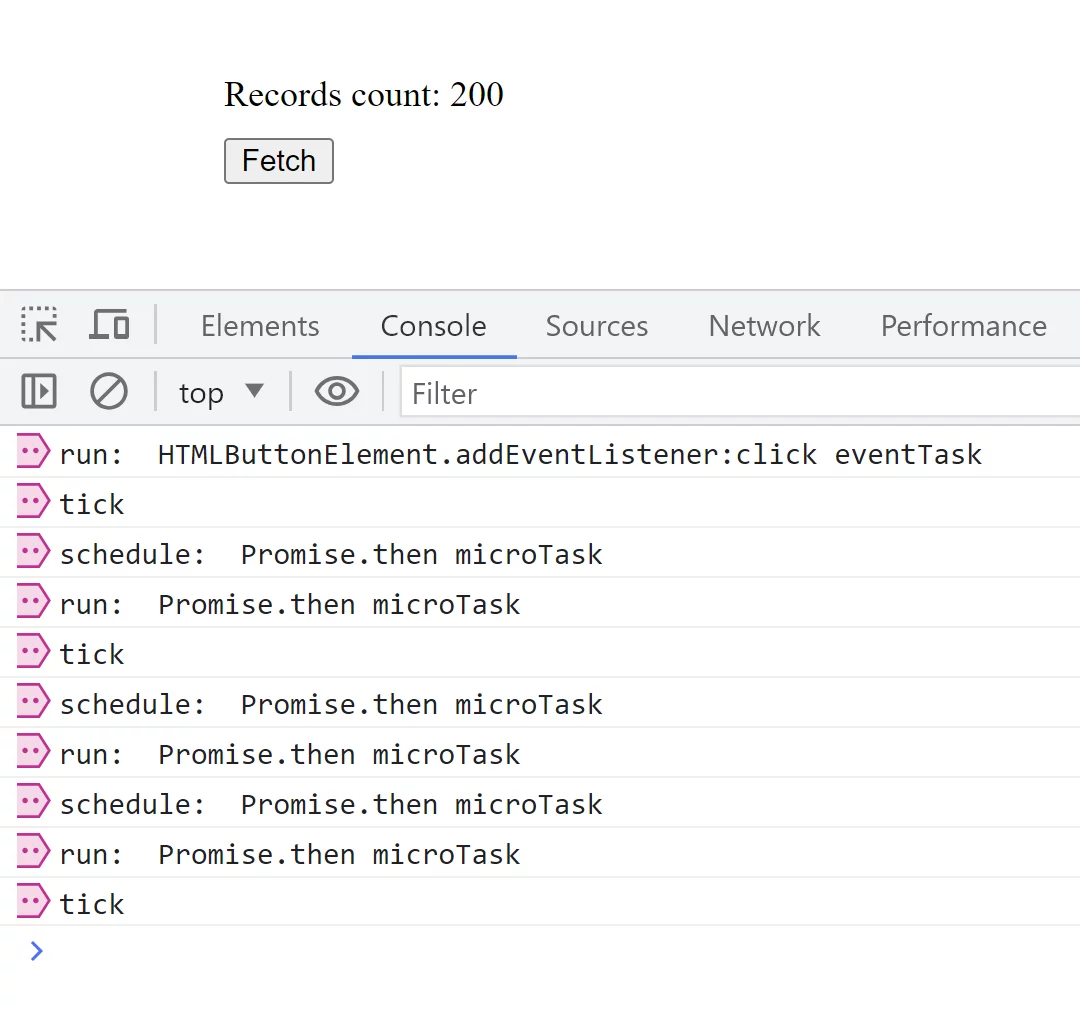
We can see the click handler being run and a bunch of promises being scheduled.
There’s, however, no macrotask scheduled for the fetch API method.
This is because zone.js doesn't schedule a task for the network request itself,
but instead simply calls a browser API immediately.
The call to the native API is then wrapped into the synthetic promise, so we end up with 3 promises –
2 that come from our application code and one that wraps the fetch macrotask from zone.js.
While we can see that promises are scheduled, it doesn't help us identify the root cause for the promise microtask.
For that, we'll need to put a breakpoint into the scheduleMicroTask function and explore the callstack:
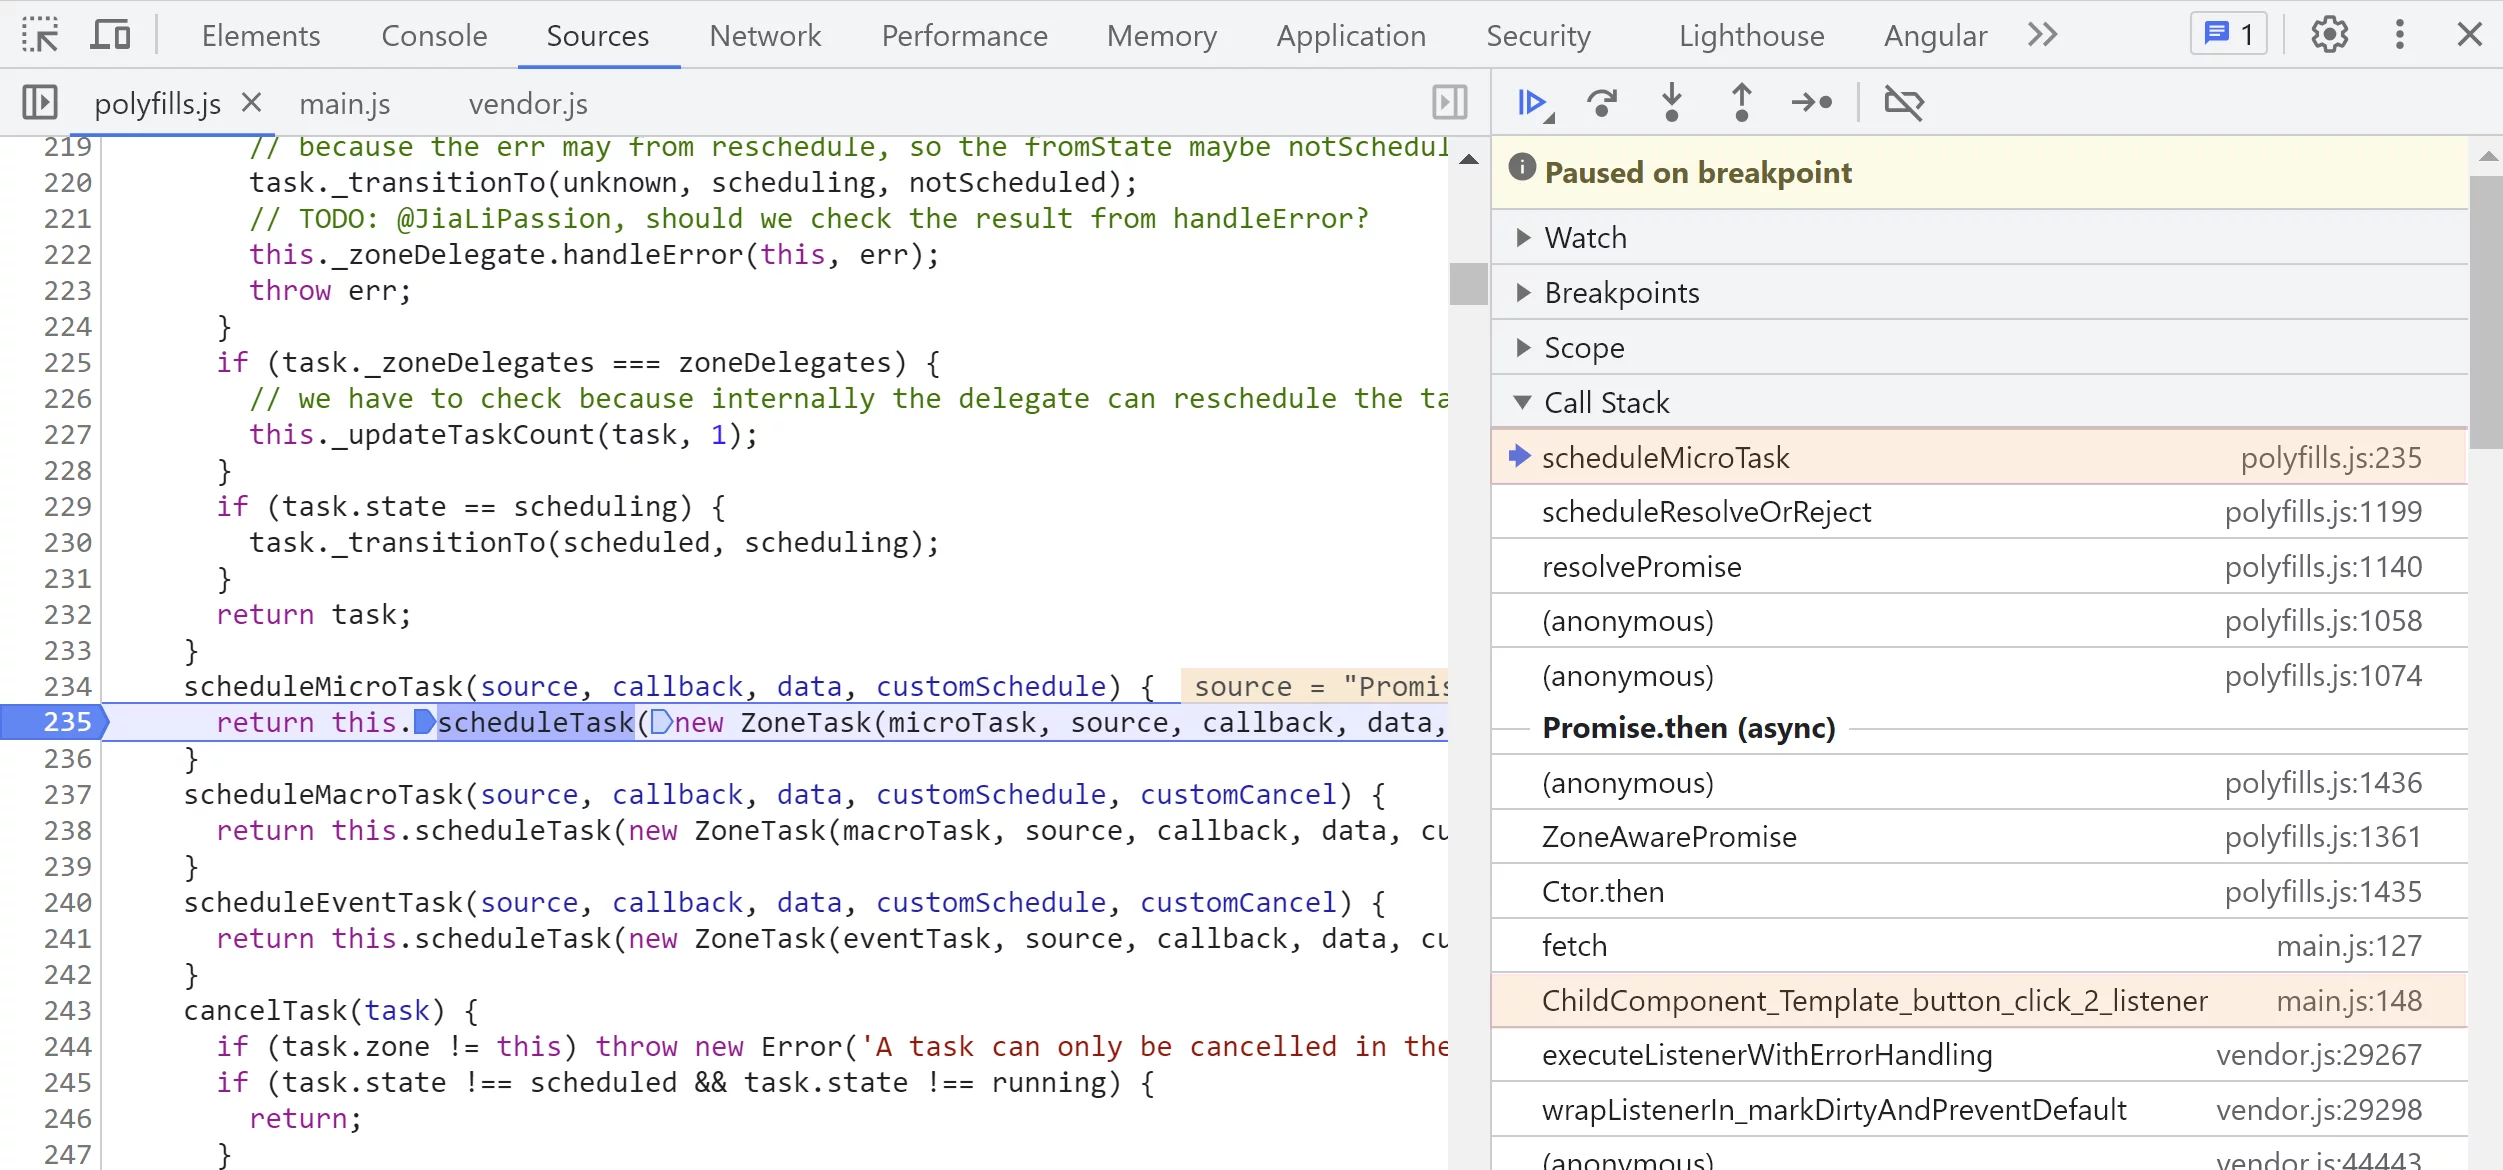
Here we can see the that promise originates from the click event handler.
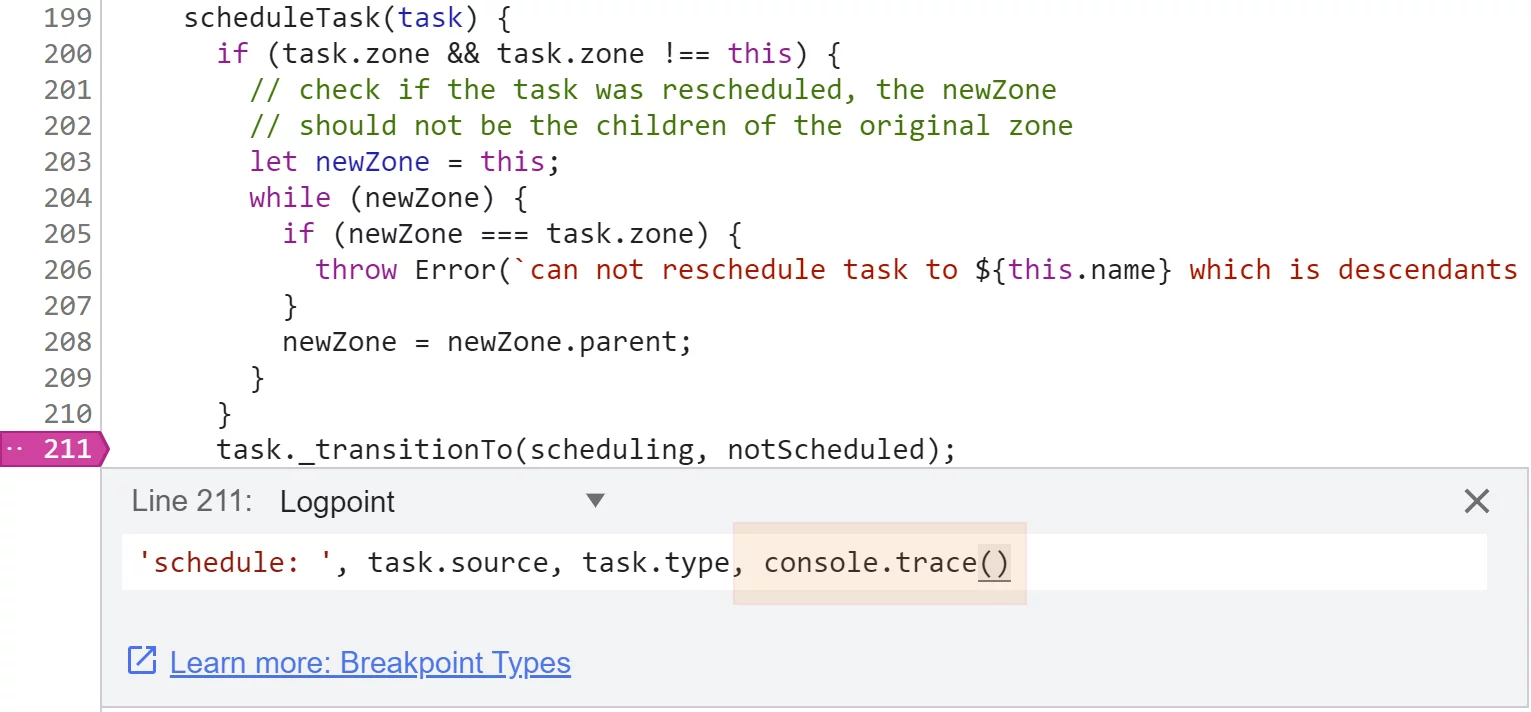
Console.trace
Another approach is to use
console.trace
expression in logpoints:
Clicking the button will output the following:
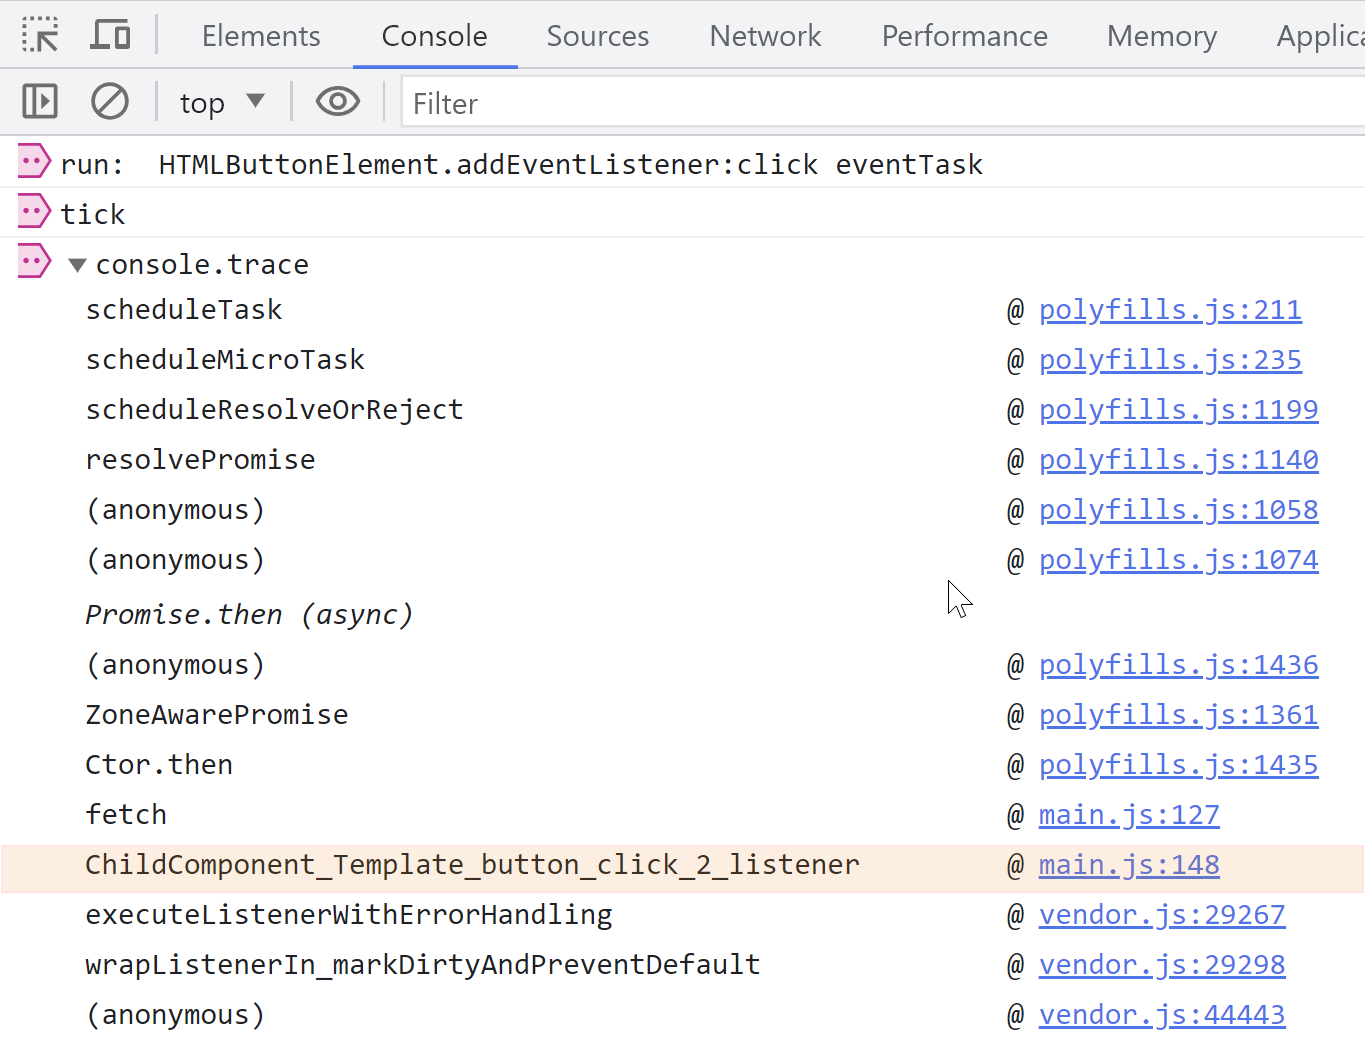
There again we can see that the promise originated from the click event handler.
When you have lots of output, however, it’s not convenient that traces are expanded by default.
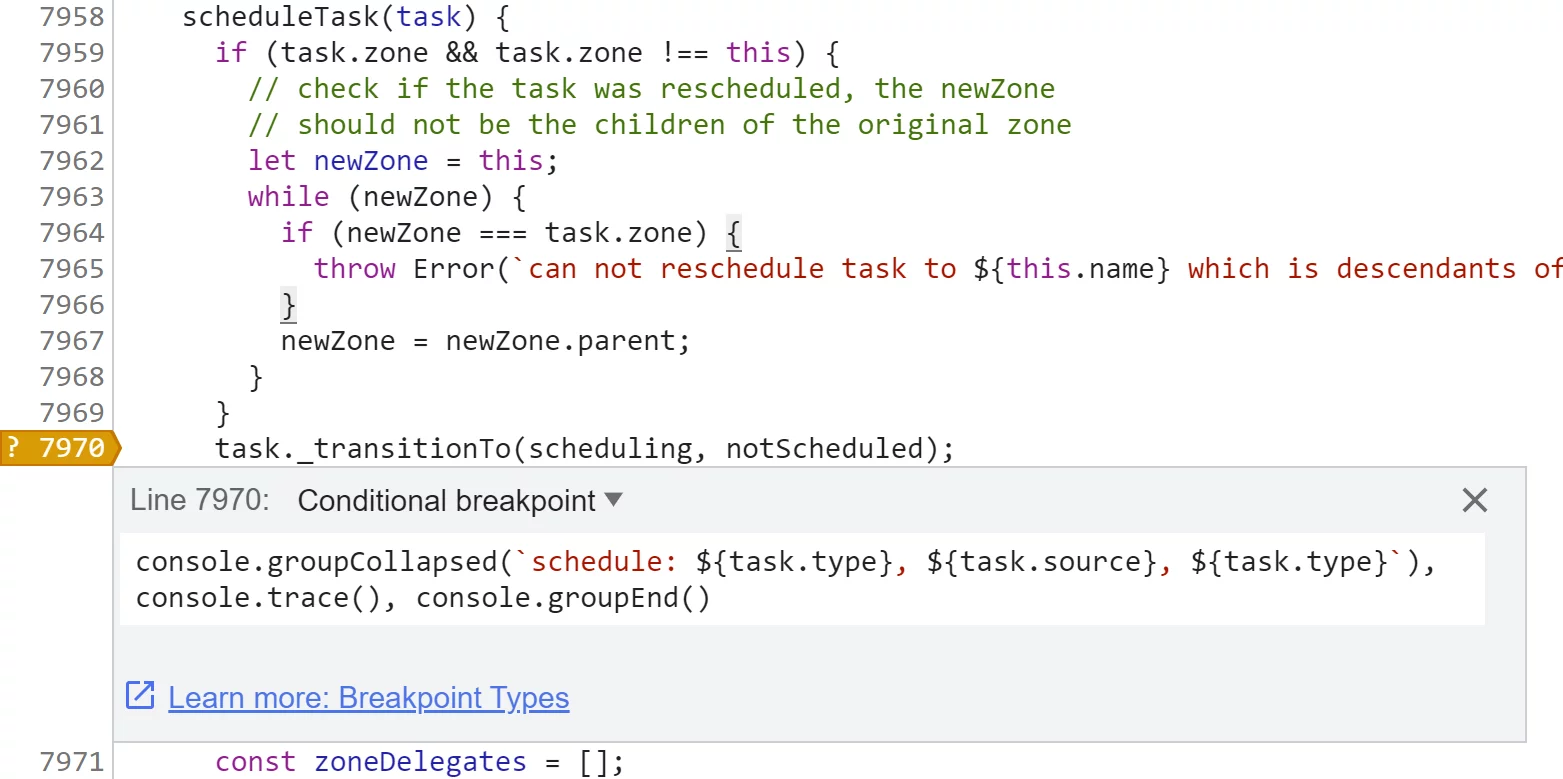
To have them collapsed when added to the console, we can use groupCollapsed API:
console.groupCollapsed(`schedule: ${task.type}, ${task.source}, ${task.type}`),
	console.trace(),
	console.groupEnd();
We need this code executed when the script execution gets inside the scheduleTask function.
It won't work with logpoints, so we'll need to use a conditional breakpoint instead.
Inside the conditional logpoint we'll execute the statements that will log what we need,
but since the last expression returns undefined,
the breakpoint condition will evaluate to false which prevents a breakpoint from pausing.
Here’s how it looks:
When we run it, we see log groups with a label that starts with the “schedule” part:
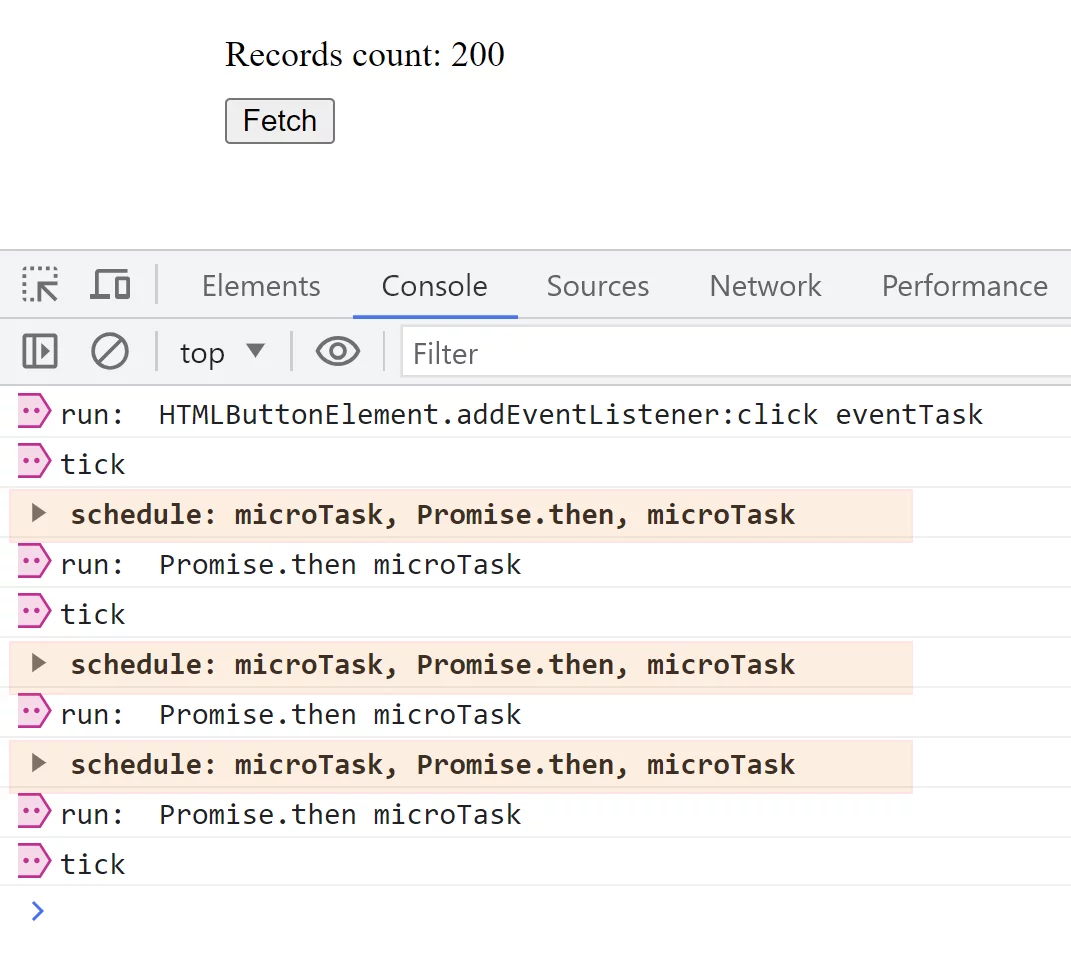
Once we expand the group, we’ll see the entire callstack printed:
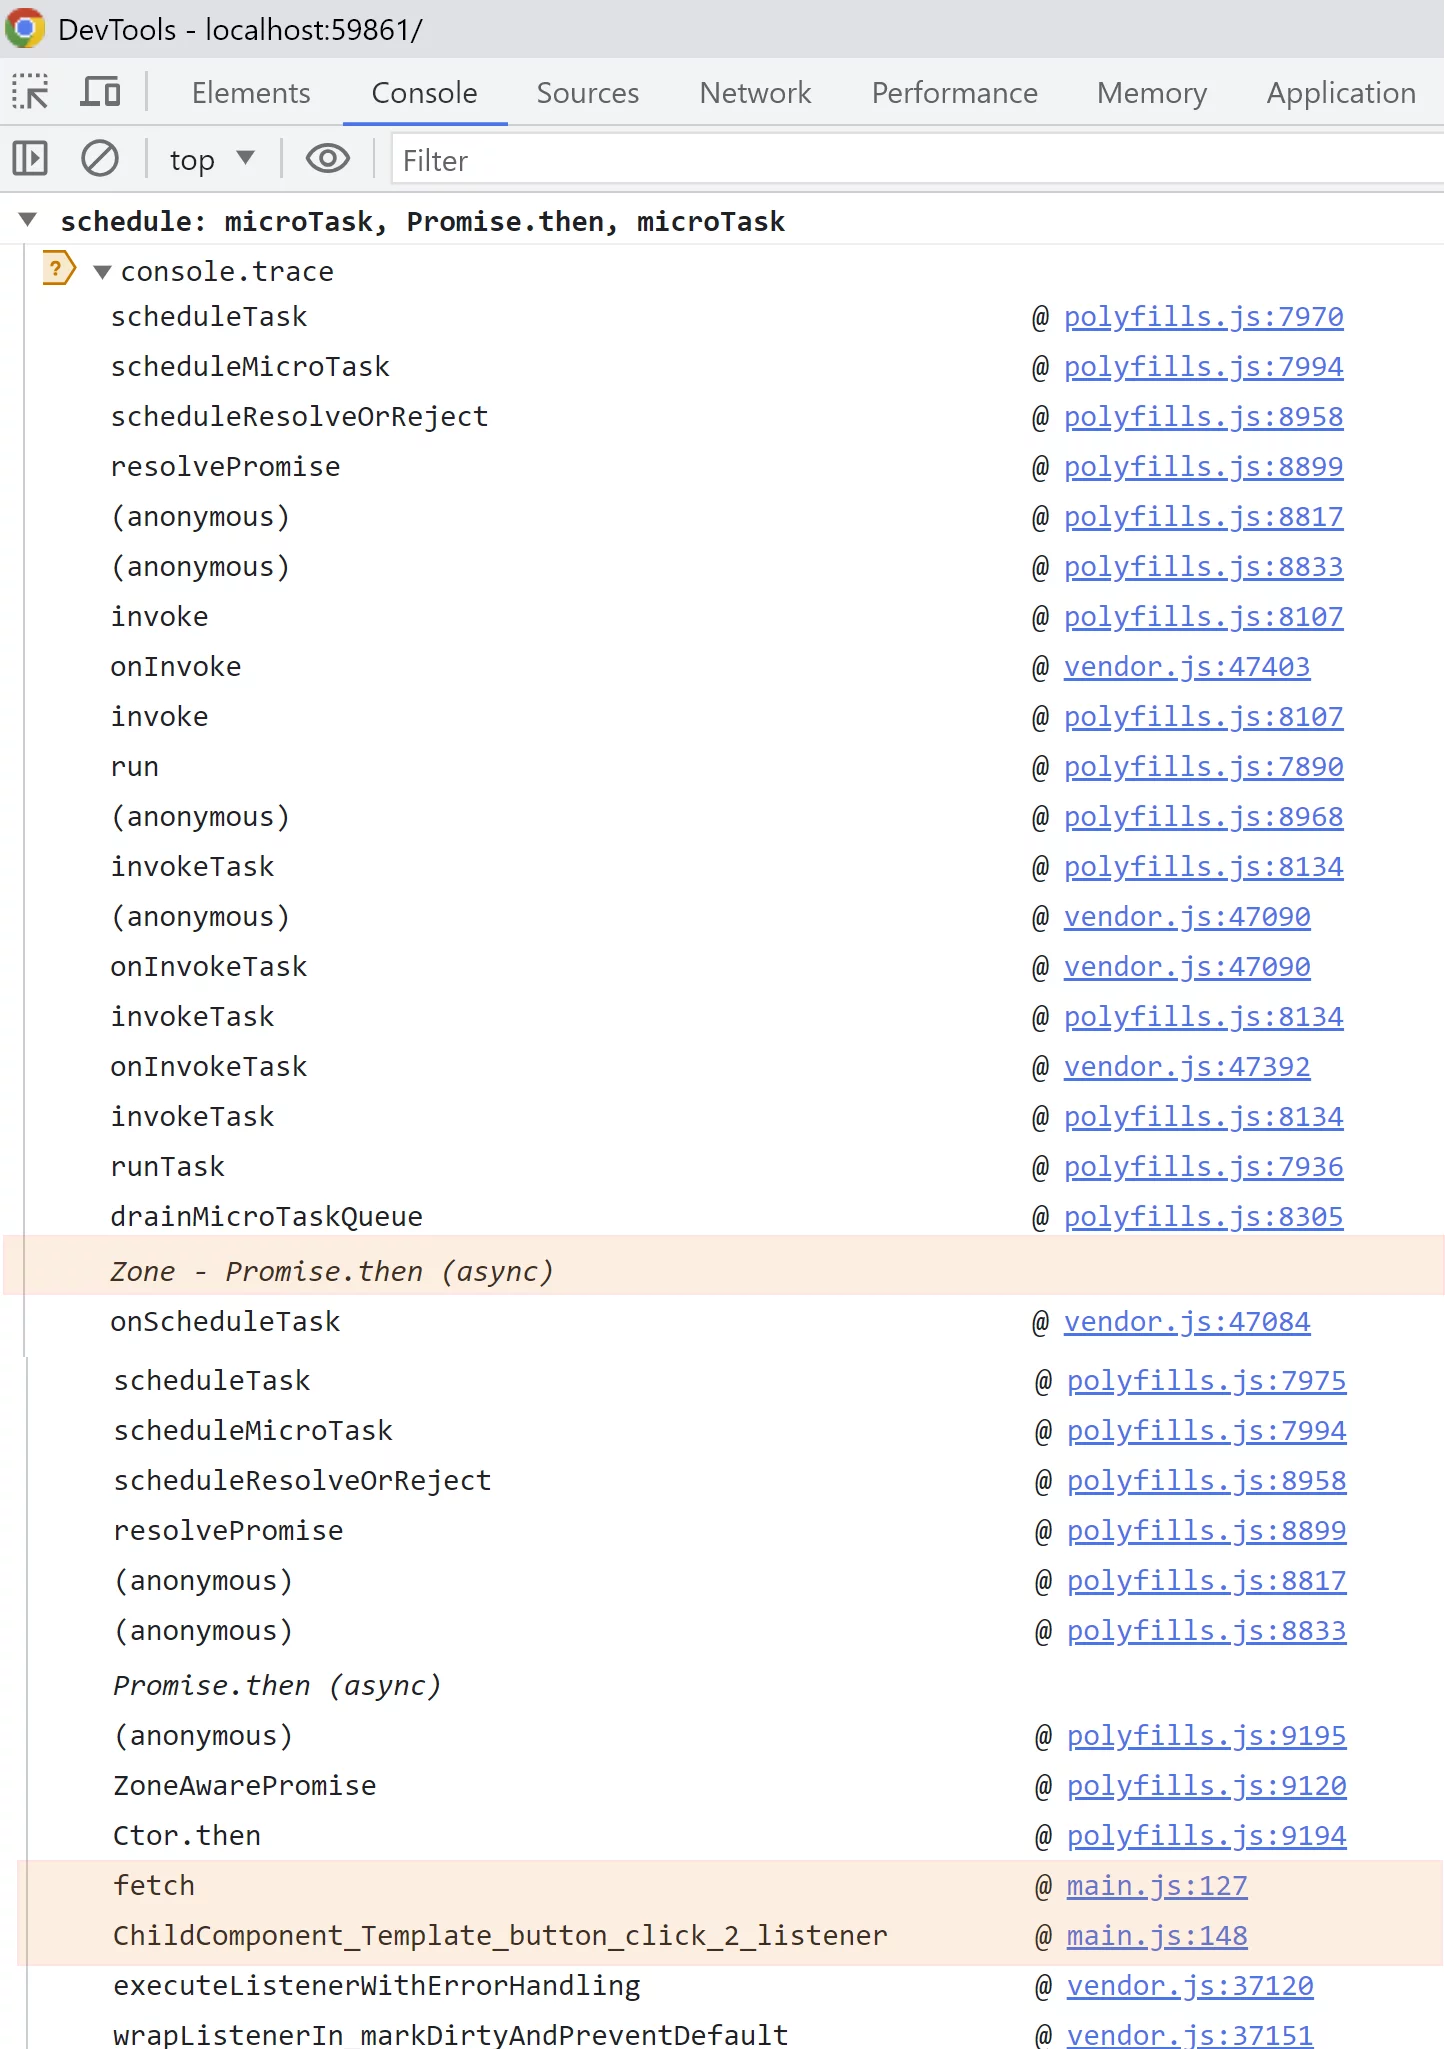
And when we scroll this callstack, we can see that the promise originated from the click event handler.
Local overrides
An alternative to using conditional breakpoints to execute the statements would be using
local override API,
which will allow us to put those expressions directly into the sources. Here’s how we could do that:
This functionality to override sources can be very handy in many situations during debugging.